Actions
Getting Started
Kickstart Training
Working with Dates
Form Designer
Tabs and Tab Permissions
Views and View Customization
Advanced Column Permissions
Item IDs
Associated Items
Print Formatting
Charts, Filters and Other Web Parts
Funnel Chart
Event Calendar
Connected Lookups
Voting Columns
List Search
Signature
Rollups
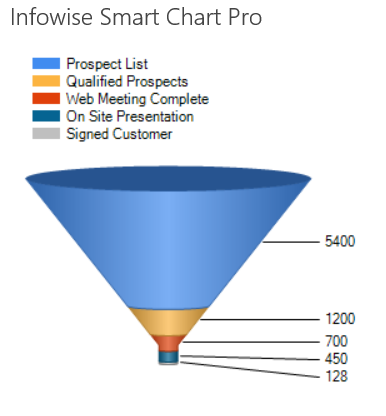
A Funnel Chart is often used to show a reductive process in which there are smaller quantities over the progression of a process. In particular this is useful for sales data. Consider this chart which indicates the progression from prospective customers to converted sales:

Instructions
- Begin by creating appropriate list data for a Funnel Chart.
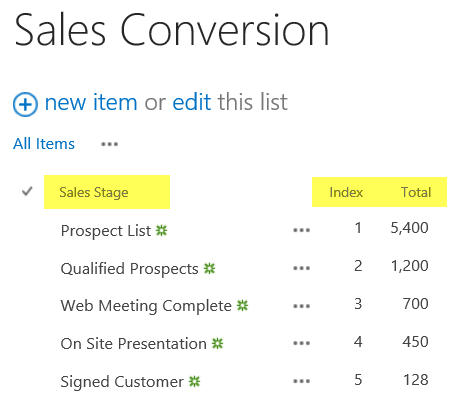
- Create a new custom list using Sales Stage, Index and Total columns.
- Rename the Title column to Sales Stage for this list.
- Add in some test data similar to below in which the values decrease for each successive record.

- Create a new SharePoint wiki page called Sales Conversion Chart.
- Add in a Smart Chart web part as described on the Column Chart page.
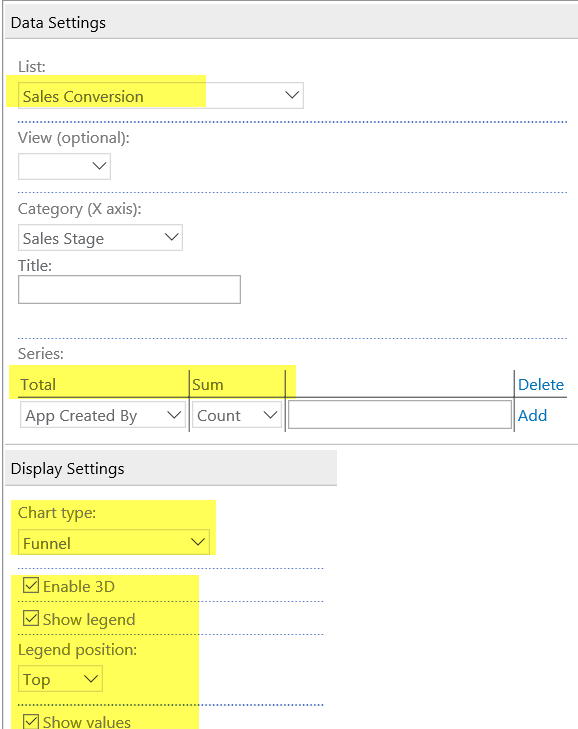
- Set Sales Stage to be used for the Category.
- Use the Total column with the Sum setting for the Series.
- Use the Show Values option with this chart.

Summary
A Funnel Chart typically only fits a very specific type of data set. Consider this type of chart when demonstrating progression toward a goal via a process of elimination.
Last modified: 4/29/2025 8:53 PM
Loading...
Add your comment
Comments are not meant for support. If you experiencing an issue, please open a support request.
Reply to: from