Hello,
We are proud to announce the new major release for Color Field, our custom field that allows color-coding your list views and items.
Not only does Color Field receive the new Icon mode, where you can assign an icon instead of color (a great feature in its own right, we even let you select from 60 available icons or link your own), we are bundling in a whole new field, the Indicator Field!
Indicator Field allows you to highlight data in other number, currency or date/time columns in the list, so you can instantly know where you stand.
The Indicator Field has 3 modes:
- KPI - define 3 ranges (low, medium and high) and assign icons to each range. The field will show the correct icon depending on the linked column value.
- Progress Bar - define value column and goal value (which can be a column, a function or a typed-in value). You will see a progress bar depicting the value in relation to goal.
- Countdown - link to any date/time column and show remaining (or elapsed) time. You can even define what units to show!
Note: this is a MAJOR release, if you already have a license for Color Field, you can upgrade only if your license includes Annual Support, otherwise you need to reinstate and purchase support.
Get your 30-day trial version now!
Add your comment
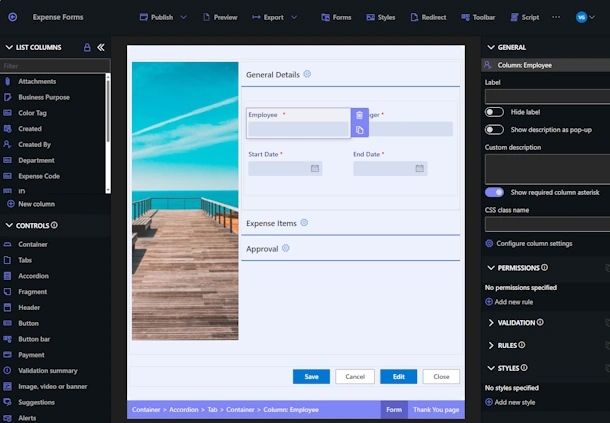
Flexible Forms
Convenient responsive modern forms, featuring tabs, section and column permissions, dynamic rules, repeating sections, electronic signatures and input validation, while keeping all your data safely inside SharePoint.
Smart dynamic SharePoint forms provide an exceptional user experience, improve data quality and simplify business processes, saving you valuable resources.
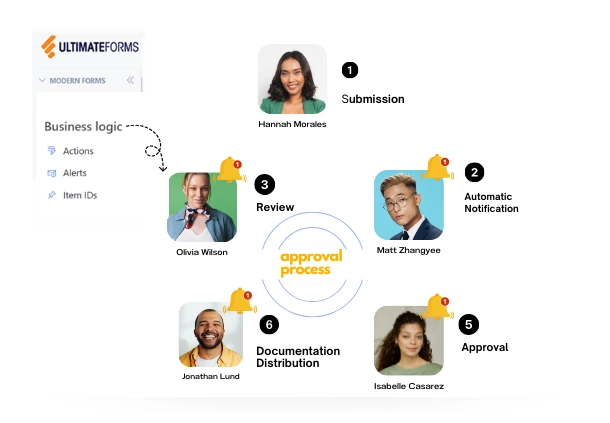
Intuitive Automation
Replace complex SharePoint and Power Automate workflows with simple, but versatile Actions to create and update data inside SharePoint and in a variety of integrated applications, such as Exchange, MS SQL, Teams and many more.
By reducing the learning curve, you empower more people in your organization to create and manage business solutions, successfully removing bottlenecks.
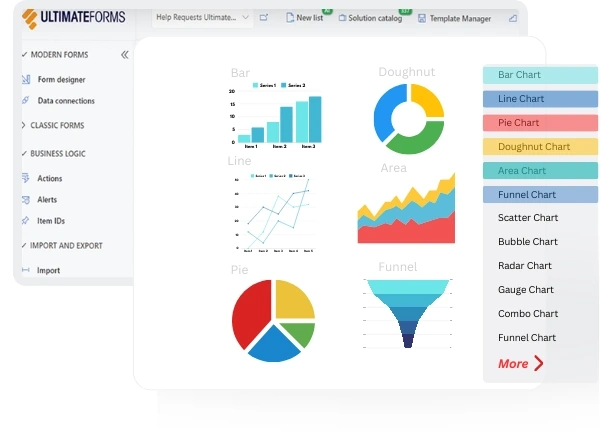
Clear Reporting
Present data as actionable insights with detailed shareable reports, dashboards, KPIs, calendars and charts.
Everyone is able to visualize information in an accessible fashion, improving responsiveness and accountability.
100’s of Templates