Hello,
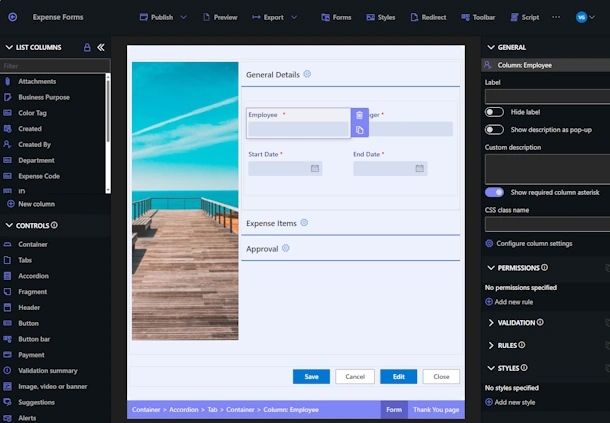
We are happy to announce the new feature set we've just added to Smart Filter Pro - our state-of-the-art filtering web part. You can now display your filter as an expanding tree, clicking on any node in that tree will filter the connected web parts accordingly.
You create the tree by defining one or more lookup filter and setting "Show as tree" for each of them. Each filter makes up a level in the tree, according to the filter order (you can easily control the order as well). For instance, your first filter is a lookup to Category and the second one - to Subcategory. Whenever you click on any node in the second level, the connected web parts are filtered by both Category and Subcategory, click on the first level - you are only filtering by Category.

You can still define and use additional, non-tree filters as well, as you could in the previous versions.
Another great addition: right-click any node in the tree and you see a menu for creating new item. Click on the menu and a pop-up shows up where you can enter data for your new item. Depending on the node you clicked in the tree, some columns are filled in automatically and are not even show on the form!

Get a trial version today!
Add your comment
Flexible Forms
Convenient responsive modern forms, featuring tabs, section and column permissions, dynamic rules, repeating sections, electronic signatures and input validation, while keeping all your data safely inside SharePoint.
Smart dynamic SharePoint forms provide an exceptional user experience, improve data quality and simplify business processes, saving you valuable resources.
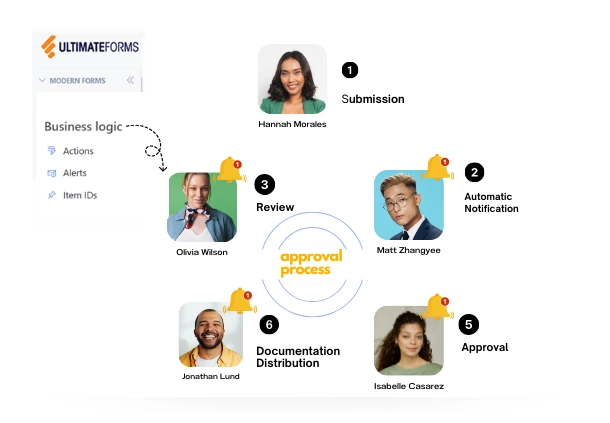
Intuitive Automation
Replace complex SharePoint and Power Automate workflows with simple, but versatile Actions to create and update data inside SharePoint and in a variety of integrated applications, such as Exchange, MS SQL, Teams and many more.
By reducing the learning curve, you empower more people in your organization to create and manage business solutions, successfully removing bottlenecks.
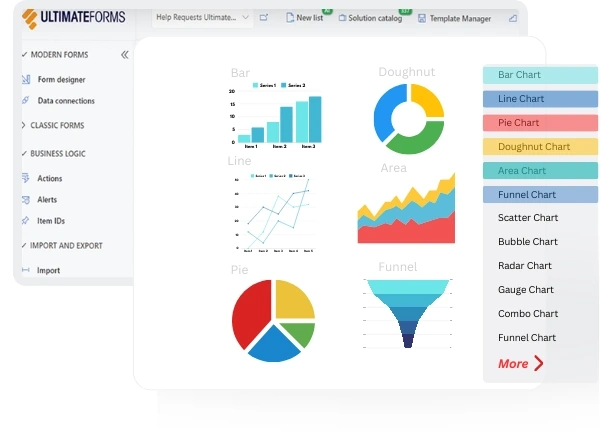
Clear Reporting
Present data as actionable insights with detailed shareable reports, dashboards, KPIs, calendars and charts.
Everyone is able to visualize information in an accessible fashion, improving responsiveness and accountability.
100’s of Templates