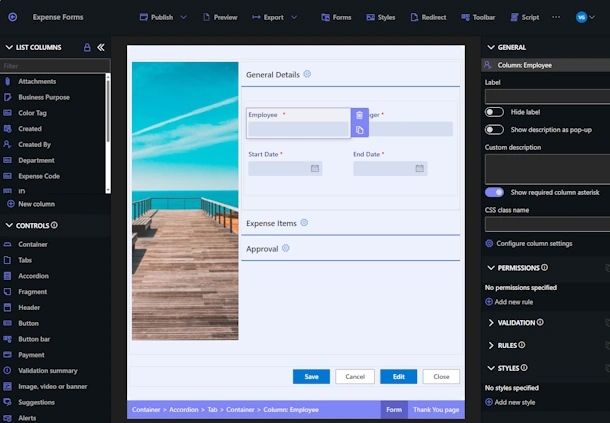
The Project Change Log Form is a comprehensive tool designed to document and manage changes throughout a project’s lifecycle. This form captures the details of each change, including its type, priority, and status, along with a thorough description and rationale. By maintaining a centralized record of all changes, project teams can track how each adjustment affects the project’s scope, budget, timeline, and resource allocation, ensuring that all modifications are clearly documented and easily accessible.
With sections dedicated to risk assessment and impact analysis, the form enables teams to evaluate each change’s potential impact and to consider strategies for risk mitigation. This structured approach ensures that stakeholders understand both the necessity of the change and its implications, promoting informed decision-making and alignment among all parties involved.
Additionally, the form’s design supports accountability, as it identifies key decision-makers, consulted stakeholders, and implementation owners. This transparency not only helps to maintain project continuity but also streamlines communication, making it easier to review the history of project changes and their outcomes.
For more info, click here.
Flexible Forms
Convenient responsive modern forms, featuring tabs, section and column permissions, dynamic rules, repeating sections, electronic signatures and input validation, while keeping all your data safely inside SharePoint.
Smart dynamic SharePoint forms provide an exceptional user experience, improve data quality and simplify business processes, saving you valuable resources.
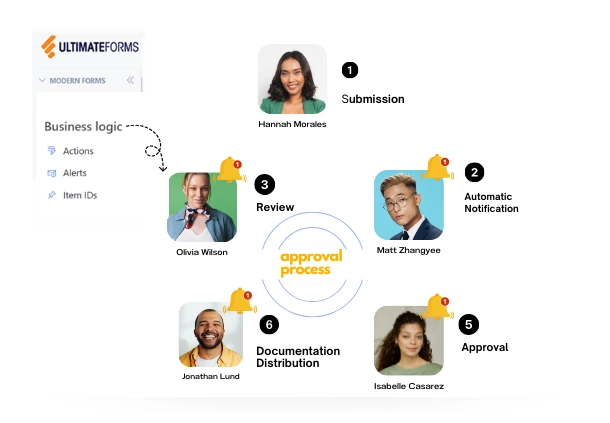
Intuitive Automation
Replace complex SharePoint and Power Automate workflows with simple, but versatile Actions to create and update data inside SharePoint and in a variety of integrated applications, such as Exchange, MS SQL, Teams and many more.
By reducing the learning curve, you empower more people in your organization to create and manage business solutions, successfully removing bottlenecks.
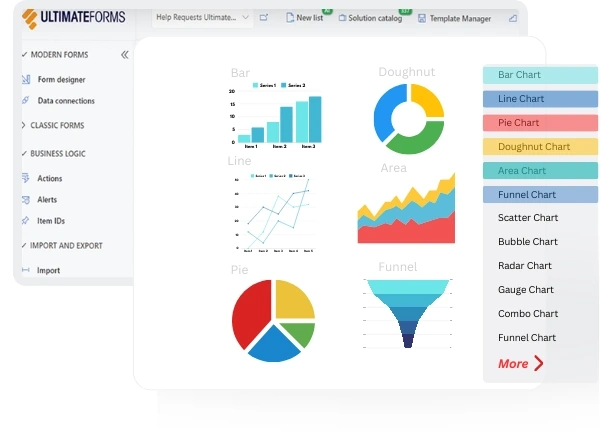
Clear Reporting
Present data as actionable insights with detailed shareable reports, dashboards, KPIs, calendars and charts.
Everyone is able to visualize information in an accessible fashion, improving responsiveness and accountability.
100’s of Templates