This Market Research Survey is a powerful tool for gaining deep insights into your target market's preferences, behaviors, and expectations. By collecting detailed feedback from your audience, you can uncover valuable data that will help you make informed decisions to enhance your products and services.
The survey starts by gathering demographic information, such as age, gender, education level, and income, providing a comprehensive view of your target audience. It then delves into their purchasing habits, including how often they buy products/services in your industry and what factors influence their purchasing decisions.
Furthermore, the survey explores customer satisfaction levels, likelihood of recommending your products/services, and preferences for receiving information about new products or promotions.
Overall, this Market Research Survey is a crucial tool for businesses looking to understand their market better and improve their offerings based on customer feedback.
For more info, click here.
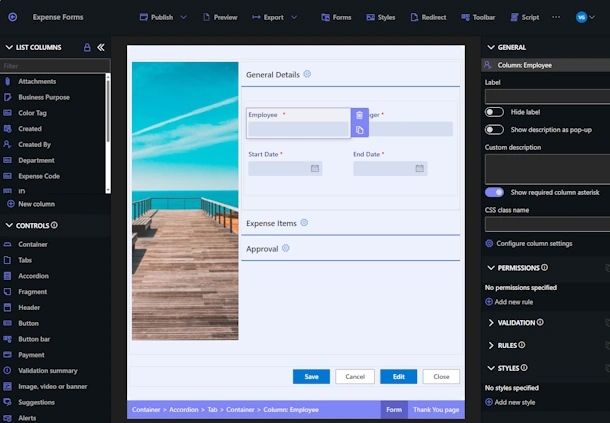
Flexible Forms
Convenient responsive modern forms, featuring tabs, section and column permissions, dynamic rules, repeating sections, electronic signatures and input validation, while keeping all your data safely inside SharePoint.
Smart dynamic SharePoint forms provide an exceptional user experience, improve data quality and simplify business processes, saving you valuable resources.
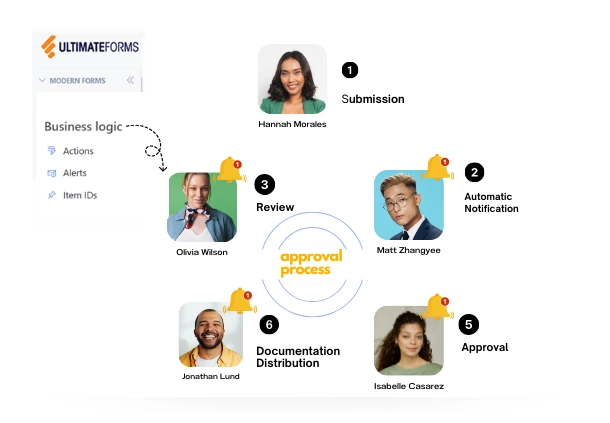
Intuitive Automation
Replace complex SharePoint and Power Automate workflows with simple, but versatile Actions to create and update data inside SharePoint and in a variety of integrated applications, such as Exchange, MS SQL, Teams and many more.
By reducing the learning curve, you empower more people in your organization to create and manage business solutions, successfully removing bottlenecks.
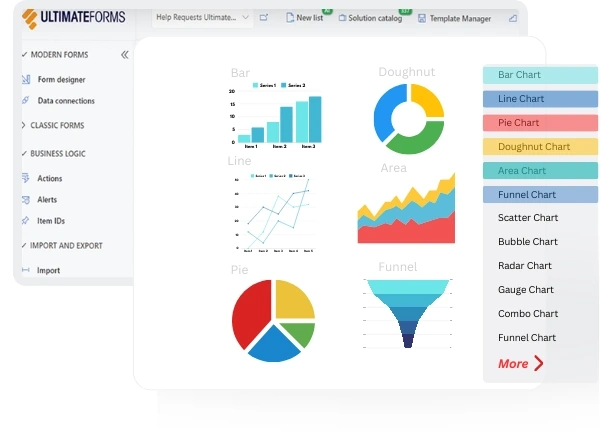
Clear Reporting
Present data as actionable insights with detailed shareable reports, dashboards, KPIs, calendars and charts.
Everyone is able to visualize information in an accessible fashion, improving responsiveness and accountability.
100’s of Templates