The Sales Revenue Report form is a tool designed to provide a comprehensive analysis of your sales performance. This form enables you to track and monitor key metrics such as total sales revenue, total units sold, and average selling price per unit. By collecting this data, you can gain valuable insights into your sales performance and make informed decisions to drive business growth.
One of the key features of this form is the ability to analyze product performance. You can easily see which products are driving revenue and which ones may need additional attention. The form also includes a regional sales breakdown, allowing you to identify which regions are performing well and which ones may require a different approach. Additionally, the form provides a detailed overview of sales by channel, helping you understand where your sales are coming from and how each channel is contributing to your overall revenue.
The form also enables you to evaluate the performance of your sales team, recognizing top performers and identifying areas for improvement. Overall, this form is an invaluable tool for any business looking to optimize its sales performance and drive success.
For more info, click here.
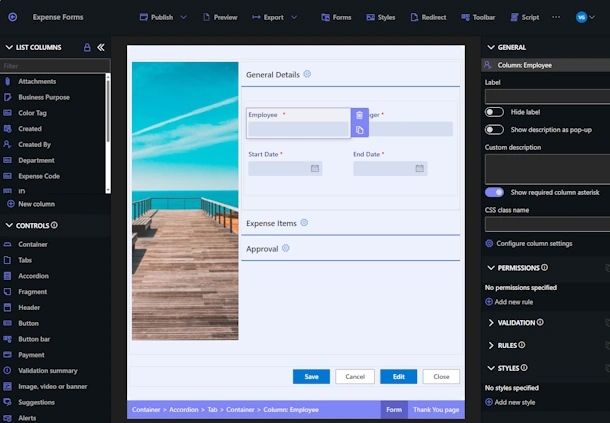
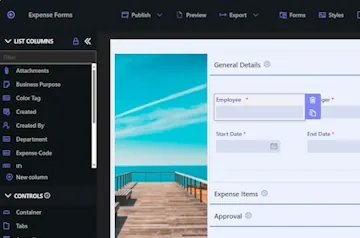
Flexible Forms
Convenient responsive modern forms, featuring tabs, section and column permissions, dynamic rules, repeating sections, electronic signatures and input validation, while keeping all your data safely inside SharePoint.
Smart dynamic SharePoint forms provide an exceptional user experience, improve data quality and simplify business processes, saving you valuable resources.
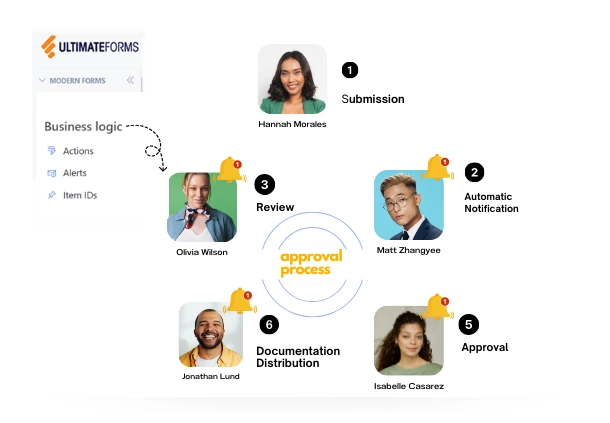
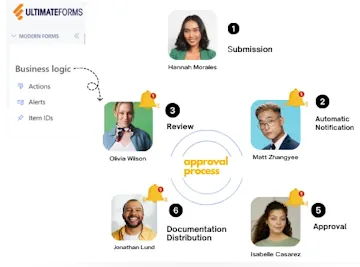
Intuitive Automation
Replace complex SharePoint and Power Automate workflows with simple, but versatile Actions to create and update data inside SharePoint and in a variety of integrated applications, such as Exchange, MS SQL, Teams and many more.
By reducing the learning curve, you empower more people in your organization to create and manage business solutions, successfully removing bottlenecks.
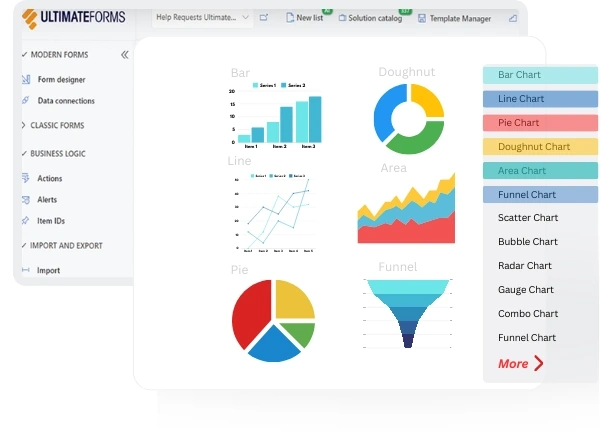
Clear Reporting
Present data as actionable insights with detailed shareable reports, dashboards, KPIs, calendars and charts.
Everyone is able to visualize information in an accessible fashion, improving responsiveness and accountability.
100’s of Templates