A daily project progress report form is a vital instrument in project management that facilitates effective communication, tracking, and decision-making. It serves as a structured document where team members provide detailed insights into their daily activities, contributing to a comprehensive overview of the project's status.
This report begins with essential project information, including the project name, ID or number, and the date of the report. It also identifies the reporting team member and their role within the project. The report covers various aspects of the project, including a summary of completed tasks, plans for the next day, encountered challenges, hours worked, and expenses incurred.
By collecting this data daily, project managers gain real-time visibility into project progress, identify potential bottlenecks or risks, and allocate resources more efficiently. It also fosters accountability among team members, as they are responsible for documenting their contributions and addressing any issues promptly. Overall, a well-structured daily project progress report form is a fundamental tool for ensuring projects stay on track and achieve their objectives.
For more info, click here.
Flexible Forms
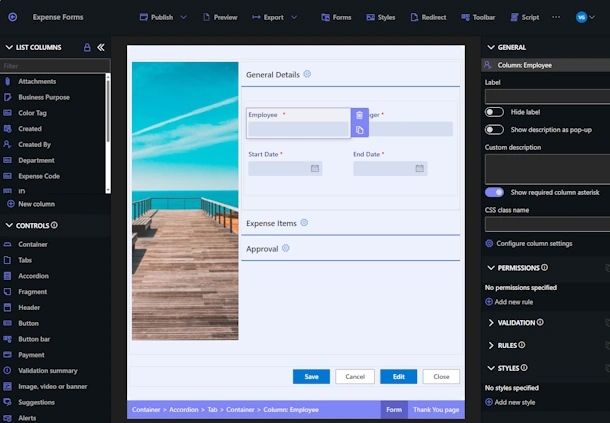
Convenient responsive modern forms, featuring tabs, section and column permissions, dynamic rules, repeating sections, electronic signatures and input validation, while keeping all your data safely inside SharePoint.
Smart dynamic SharePoint forms provide an exceptional user experience, improve data quality and simplify business processes, saving you valuable resources.
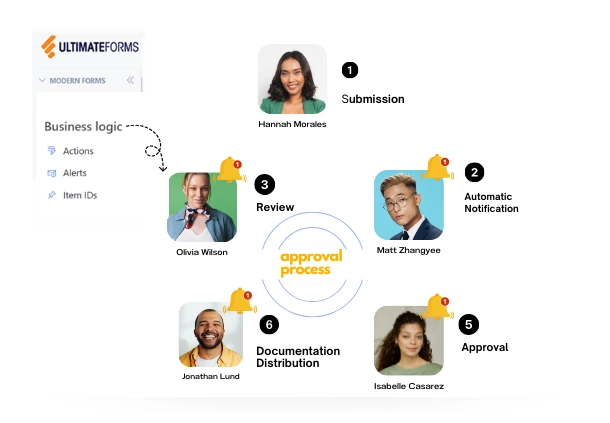
Intuitive Automation
Replace complex SharePoint and Power Automate workflows with simple, but versatile Actions to create and update data inside SharePoint and in a variety of integrated applications, such as Exchange, MS SQL, Teams and many more.
By reducing the learning curve, you empower more people in your organization to create and manage business solutions, successfully removing bottlenecks.
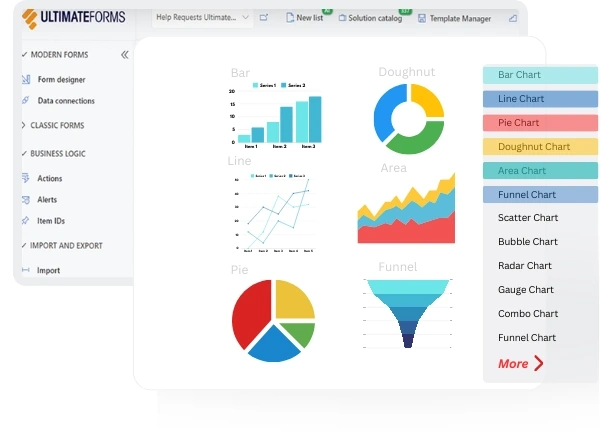
Clear Reporting
Present data as actionable insights with detailed shareable reports, dashboards, KPIs, calendars and charts.
Everyone is able to visualize information in an accessible fashion, improving responsiveness and accountability.
100’s of Templates