The purpose of the Logo Design Questionnaire template is to gain insight into your customers' unique logo preferences and ideas. By utilizing this online questionnaire, you can streamline the creation process and effectively meet your customers' expectations by asking the appropriate questions from the beginning. The first step includes questions that will help you comprehend your customers' vision for their logo. The second step collects information about the ideal logo for your client. The last step includes the budget and terms.
You can modify this template to better fit your needs by rephrasing the questions or adding your own.
For more info, click here.
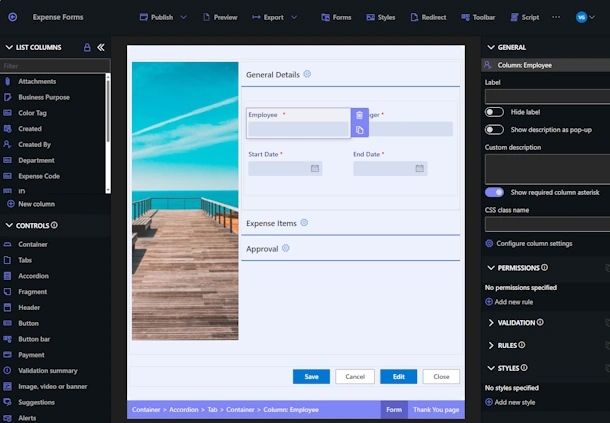
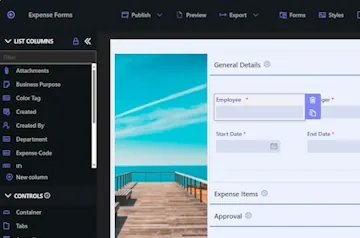
Flexible Forms
Convenient responsive modern forms, featuring tabs, section and column permissions, dynamic rules, repeating sections, electronic signatures and input validation, while keeping all your data safely inside SharePoint.
Smart dynamic SharePoint forms provide an exceptional user experience, improve data quality and simplify business processes, saving you valuable resources.
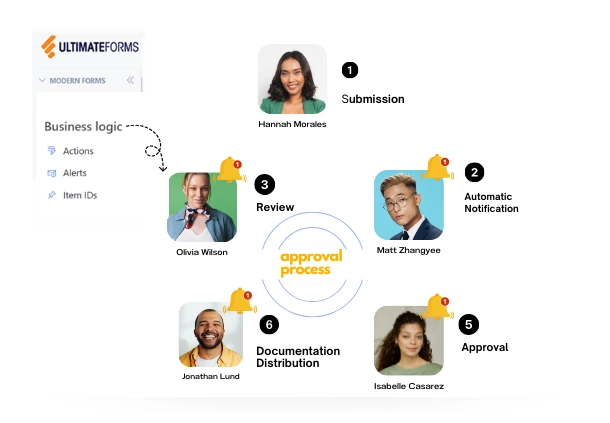
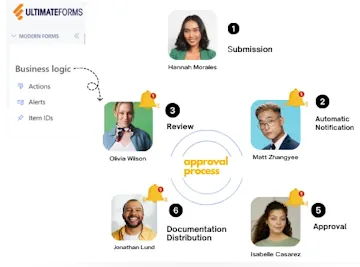
Intuitive Automation
Replace complex SharePoint and Power Automate workflows with simple, but versatile Actions to create and update data inside SharePoint and in a variety of integrated applications, such as Exchange, MS SQL, Teams and many more.
By reducing the learning curve, you empower more people in your organization to create and manage business solutions, successfully removing bottlenecks.
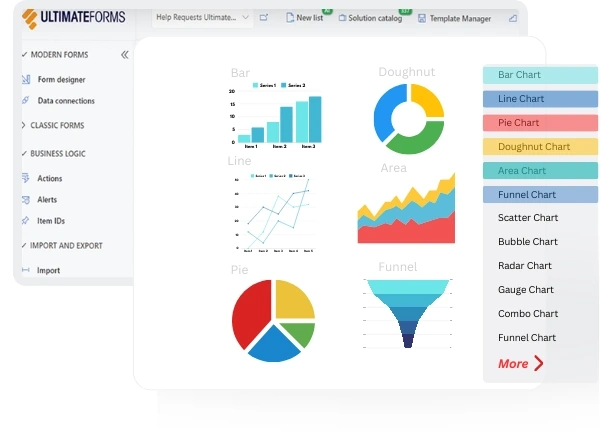
Clear Reporting
Present data as actionable insights with detailed shareable reports, dashboards, KPIs, calendars and charts.
Everyone is able to visualize information in an accessible fashion, improving responsiveness and accountability.
100’s of Templates