
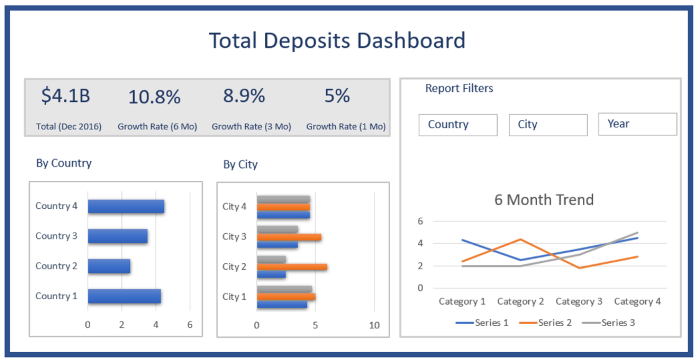
Dear Readers, I am back again with the second part of my article. I am building a bank branch dashboard to understand the deposits trends over the months.
Last week I started my project by designing the wireframe of my dashboard. Once I was sure how I wanted my charts, I began exploring options. I realized that the charts web part, which is a part of Infowise Ultimate Forms was the best options to create my dashboard. I created a proof of concept, to begin with, my development.
Read more about it here.
Defining the data schema
To begin creating a dashboard, I started by designing the table structure. We will use this table to create the charts. I added the fields: Branch Names, City, Country and Deposits of January, March, June, September and December. Once done, I included the most important thing that I need to create my graphs, data. Without data, there will be nothing to visualize.
In case you are just trying to create and check what your graphs might look like, don't forget to add some dummy data.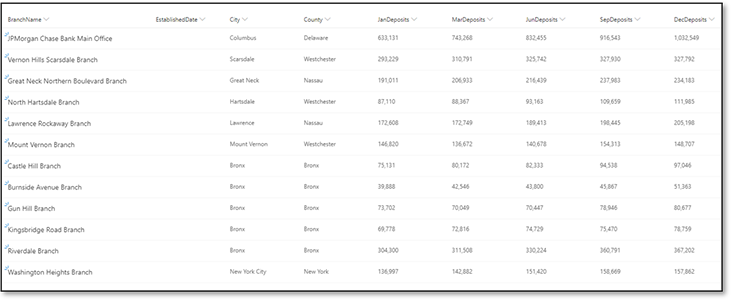
Creating a Line Graph
Armed with my knowledge that I gained by creating the proof of concept using the charts web part of Infowise Ultimate Forms, I wanted to create a line chart.
I started by clicking on design, which opens up the Infowise Portal. I love how easy it is to start editing on Infowise Ultimate Forms Portal.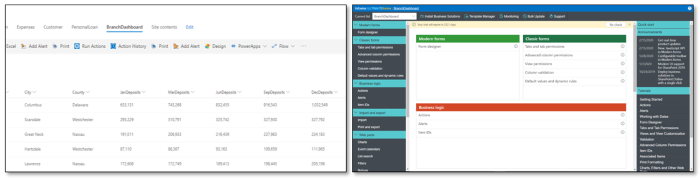
I started by clicking on the chart's web part and creating a new profile. A profile defines all the parameters of a chart, starting from defining the type of the graph to designing it.
It has four tabs, with different configurations.
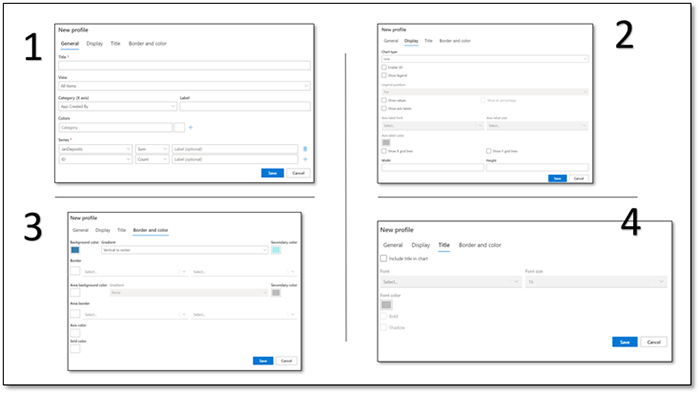
I selected the type of chart as a line graph and added values for X and Y axis of my figure. I picked the name of the bank branches on my X-axis. For the chart's series, I chose the deposits over the months.
I then added the graph to my main page by adding Infowise Ultimate Forms charts web part and selecting the profile from the dropdown.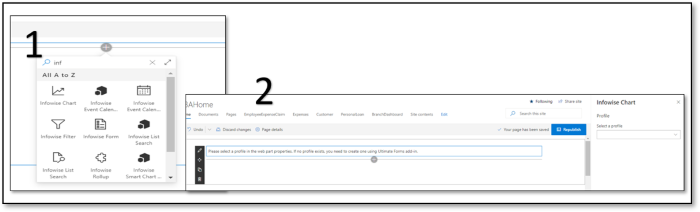
Creating a profile and adding a chart using Infowise Ultimate Forms Charts web part is very easy. You can configure and create a new chart.
Once I selected the profile that I created from the dropdown, my chart appeared. I could see how the deposits varied over months in different branches.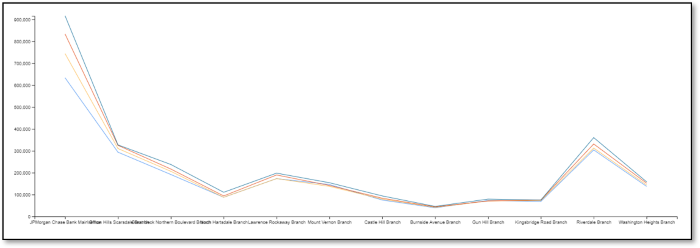
Additional Configuration for the Infowise Ultimate Forms Chart Web Part
Once I was done creating the chart, I wanted to add some colour to give it a nice look and feel. It's so simple to add a splash of colour to my graphs. I just went back to my Infowise Portal and edited my profile. I selected the Border and Color tab and added a background colour. I could add a gradient as well with a quick click. Once I save my updates and refresh my page with the graph, it automatically shows me the graph with a background colour.
There are also some other configurations available and can even a business user can update it easily.
SharePoint Chart Web Part
Though I completed my chart, I wanted to try out the SharePoint Charts web part. The default charts have minimal options, and I could only create a Bar Chart with only one set of data.
Charts Filter using Infowise Ultimate Forms Charts Web Part
I completed my charts, and they looked beautiful. I was happy, and then I realized that I missed something. I needed a filter to display only the data I wanted.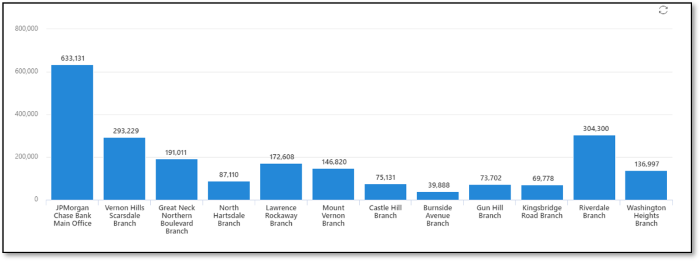
I wanted to have a list of cities in a dropdown that I can use to filter the data for my charts.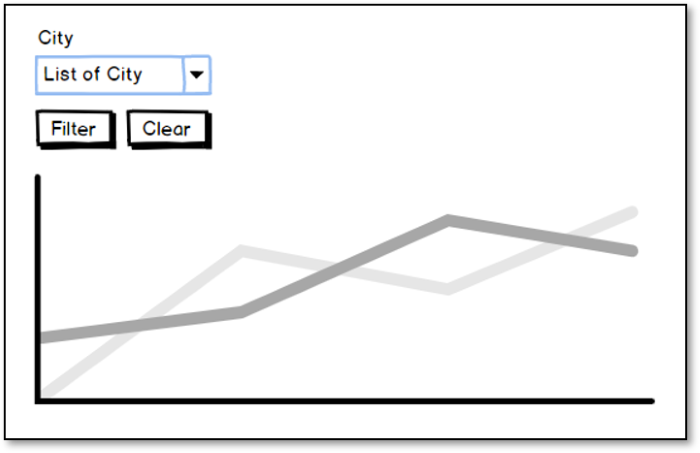
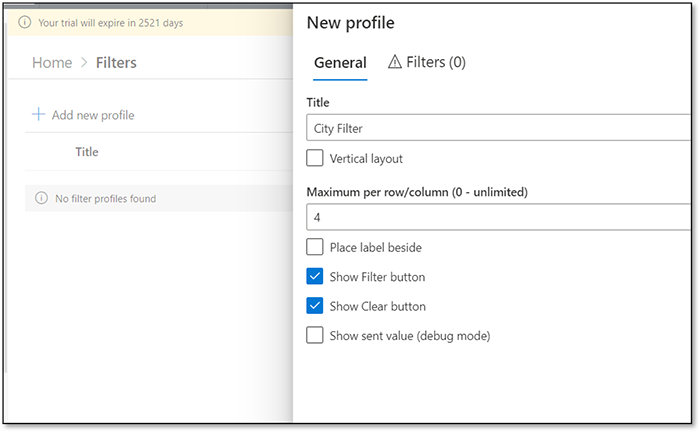
Well, it was easy. I started by creating a new profile under the Filter tab. I defined the name of the filter and added a Filter Button and a Clear Butto,n.
However, there are other configuration options also available at the click of your mouse. Showing the sent value on the debug mode helps to find out the errors if any.
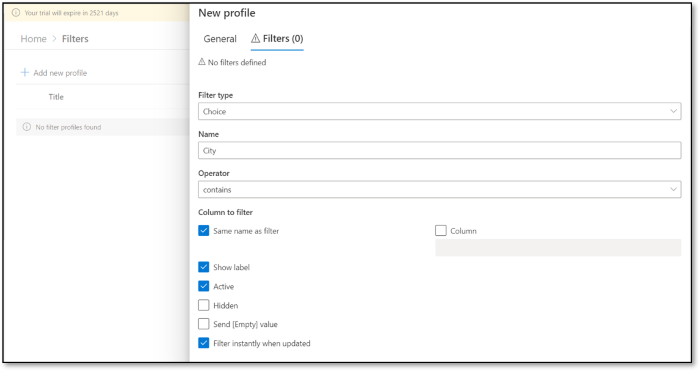
The second tab for the filter profile allows us to choose the kind of data filter we need. I can choose between a dropdown and a free text and also define if I want an exact match or not.
Another option that helps is the column to filter the checkbox. If the column name is not the same as the filter name, we can uncheck the box and update the column name in the column textbox.
For our current scenario, I wanted to filter the deposits over the months based on the Branch city. I created a dropdown with all the options for the cities.
To add the filter to our Infowise Ultimate Forms Chart, I edited my main page and added an Infowise filter web part. Like the Charts web part by Infowise, I added an Infowise filter web part. I then selected the profile I had created for the chart in the drop-down, and my filter was there on the page. Once I saved the page, I tried out the filter. It works perfectly.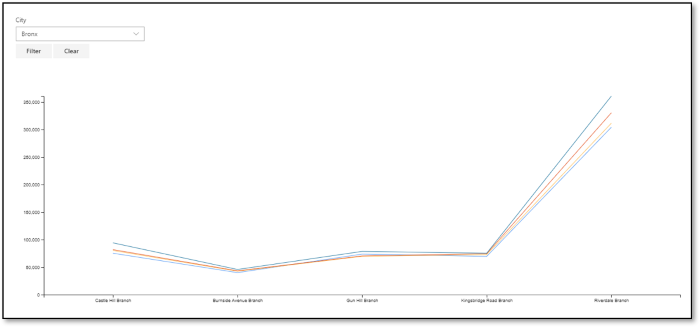
It's very user-friendly. The process of adding a filter to a chart was quick, and it was very similar to the process of adding a chart. This ensures that the learning to use the Infowise Product is very easy.
Infowise Ultimate Forms is not only a useful tool for creating forms and processes, but it is also a fantastic tool for reporting purposes as well.
Now that I have everything in place, I am ready to put all the charts together to create my Branch Dashboard. Join me next week as I finish my project.