Bubble Chart
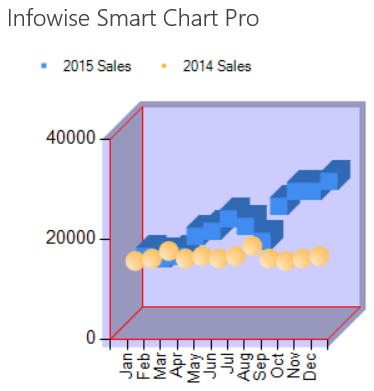
The bubble chart provides a unique view that visualizes data using "bubbles" or other 3D objects to signify the value on the chart.
Using a 3D setting on this chart type is effective when showing a comparison between two data series.
Here is example output for this chart type:

Instructions
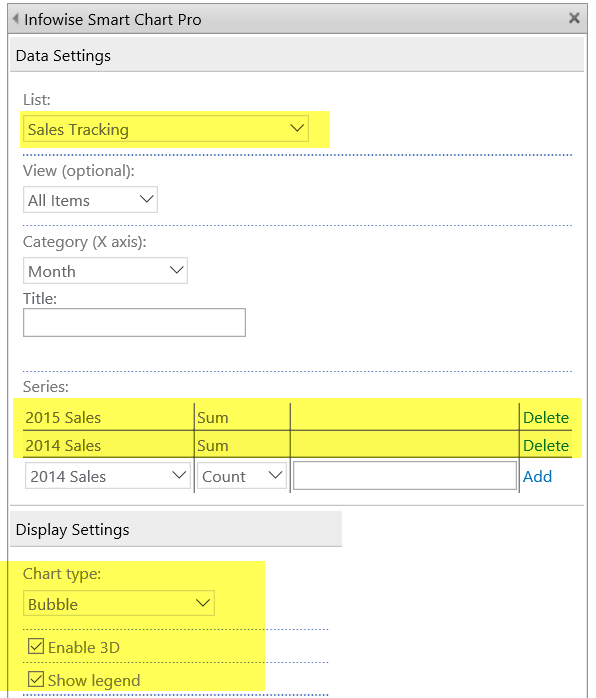
Set up your chart following the steps from the Area Chart example.
Select the Bubble chart type.

Summary
The Bubble Chart provides a unique way to visualize the chart data that uses 3D objects.
Last modified: 9/9/2017 10:44 PM