UltimateForms: Charts
Visualize your SharePoint list data using 30+ chart types with fully configurable layout. Works in Microsoft 365.
UltimateForms:
Charts
, a component of
UltimateForms, helps you visualize data from SharePoint lists.
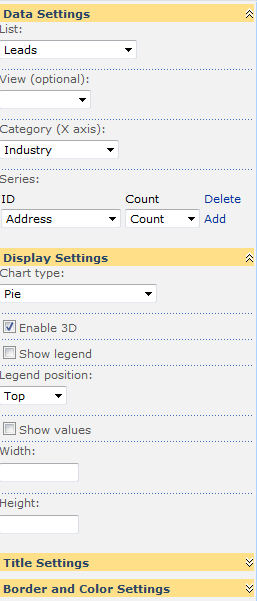
- Show your list data as a configurable chart
- Select one of 30+ chart types
- Control layout, background colors and borders
- Summarize your list data by category columns
- Use more than one data series on a single chart
- Optionally show values as percentage
- Optionally show user-defined colors for categories
- Optionally filter presented data by list view
- Works in Microsoft 365
- Localized into English, French, Spanish and German
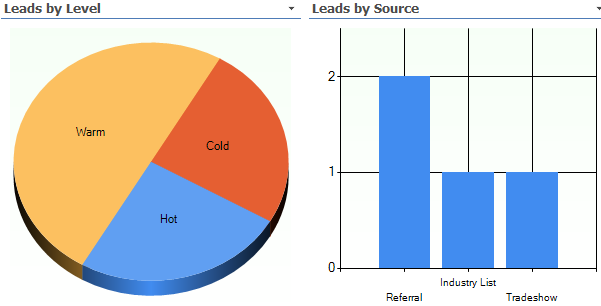
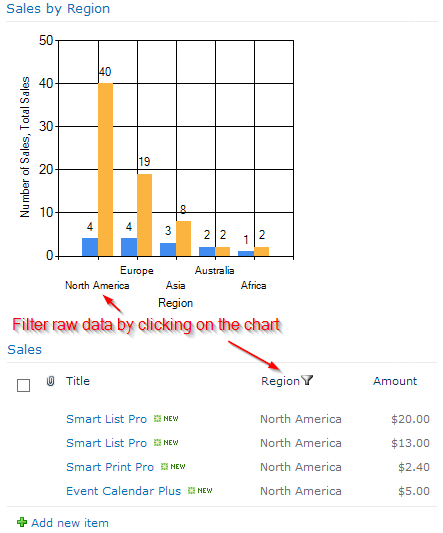
Visualize and summarize your data in easy-to-understand chart format. You can count, sum-up or calculate the average value for any number of columns. You can even connect it to Filters web part to dynamically filter represented data to create visually-appealing dashboards.
Features
| Feature | Image | Our Product | SharePoint Native |
|---|---|---|---|
| Multiple chart types |  |
||
| Connects to SharePoint lists | |
||
| Allows multiple series on a single chart | |
||
| Fully customizable look and feel | |
||
| Show values as percentage | |
||
| Localization into English, French, German and Spanish | |
|
Note: unless specifically stated otherwise, all products require only SharePoint 2016 and up. Except for SharePoint Online apps, all of our products must be installed as farm solutions.
Blog
Although this feature can be purchased and installed separately, we highly recommend always installing the complete UltimateForms suite. It will ensure you are not limited in any way when implementing your business solutions and achieve the best possible result.
$
1 user
200 users
1,000 users
- Bulk discounts to larger organizations
- Special discounts to non-profits, educational or government organizations
No credit card, no obligation.